The Traffic section of Jetpack Stats shows how many people come to your site and what they do there, helping you shape your content strategy. This guide explains each section of your website’s traffic.
In this guide
To access your website or blog’s Traffic stats, take the following steps:
- Visit your site’s dashboard.
- Click Stats on the sidebar (or Jetpack → Stats if using WP-Admin).
- The Traffic tab is selected by default. Other tabs provide stats on Insights, Subscribers, and Ads.
Traffic stats are limited on free sites and sites on our Starter plan. Upgrade your plan for complete access to stats:
The Traffic tab shares data about the activity and behavior of your site’s visitors. Stats are tracked by a pixel that loads in the visitor’s browser and records site traffic.
Analytics tools like Jetpack Stats and Google Analytics work on a sampling basis and are meant to show you a larger trend of user traffic rather than an exact head count. It will be difficult for any tool to be accurate to the last individual due to various factors, including data packet drops, time zone differences, cookie and ad blockers by users, and zones that do not permit data collection.
The following traffic will not reflect in your stats:
- Visits from browsers that do not execute JavaScript or load images or are blocking the stats pixel in some way.
- Visits from Googlebot and other search engine crawlers.
- Visits you and other team members make to your own publicly available site while logged into your WordPress.com account.
- If your site is set to private, views by you and other logged-in members of your site are counted.
- Plugin-enabled sites can control which user views will be counted in your stats for private sites by going to Jetpack → Settings → Traffic → Site Stats.
7-day highlights is a snapshot of recent traffic to your site. It will show visitors, views, likes, and comments compared to the previous seven days. You can switch to a 30-day snapshot by clicking the three-dot menu in the upper right corner of this panel.

The two main units of traffic measurement are views and visitors:
- A visitor is an individual looking at your site. Their visit is counted the first time we recognize their browser in a selected time frame.
- A view is counted when a visitor loads or reloads any page of your site.
A visitor can view your site’s many pages or the same page multiple times. Therefore, the views number is typically higher than the visitors number. You may also notice that your visitor count lags behind your views count. This is due to the way we process the numbers. Typically, a view is reported within five minutes. However, it can take up to two hours for new visitors to show up in your stats.

In the graph, you can display information per day, week, month, or year. Click on any bar in the graph to view the stats for this time period. Hover your mouse over any bar in the graph to see the Views Per Visitor, which shows the average number of views each visitor made.
The unique weekly visitors can sometimes be less than the sum of daily visitors for the same week. The same goes for unique weekly visitors being less than your total monthly visitors, and so on. This occurs when the same visitor appears multiple times during the week or month.
The Traffic chart also includes tabs for viewing stats for the number of likes and comments on your site. Click on the Likes or Comments boxes to display a bar chart for those stats.
The number of likes may be greater than the number of views if your readers liked a post without visiting your site. For example, if they liked your post from the Reader or their email.
This section of Stats will list the Posts and Pages that have received the most views in the time period you’ve specified at the top of the page.

A view is counted for a post or page when the direct link of the page/post is visited, or the full post is viewed in the Reader.
The Home page / Archives entry includes views of:
- Your site’s homepage.
- Archives including category, tag, author, and date-based (posts by month and year) pages.
- Your posts page, if you have one for your site.
- Your shop page using WooCommerce.
Some blog layouts display the full post text on the homepage. If a visitor reads a post on your site’s home page, the view will be counted for the homepage, not the post.
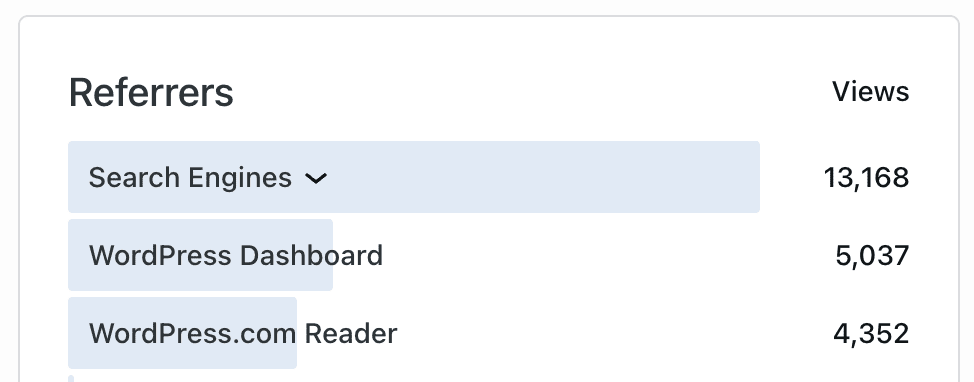
The referrers section lists other blogs, websites, and search engines that link to your site.
A view is associated with a referrer if a visitor lands on a page on your site after clicking a link on the referrer’s site.
If you see a down arrow next to a referrer, you can click on the arrow to see more specific details. For example, expanding Search Engines will show details for specific search engine referrers (Google, Bing, and more.)
The number of referrers may not match the number of total views. Not all visitors will land on your site by clicking a link somewhere else. Visitors may type your URL directly into the web browser, click a link in an email, or click a link in another application, which then loads the site.
Please also note that the default referrer policy in most browsers limits the information we can gather about the referring sites directing visitors to your site.
You can mark certain referral sources as spam to remove that referrer from displaying in your stats. The referrer link will go into your personal spam referrer block list and won’t show up in the future. It doesn’t stop traffic coming to your site from these sources, but you may not want to see them in your stats.
To mark a referrer as spam:
- Go to your Stats page.
- Hover over the referrer and click the warning symbol next to it.
- Click Mark as Spam.
Some trusted sources cannot be marked as a spam referrer.

If you change your mind immediately, you can click the warning icon again to immediately undo the mark as spam option. However, you cannot undo the action once you have navigated away from the Stats page. If you have accidentally marked a referrer as spam and cannot undo the change, please contact us. We can help with this.
You can see how many views your site has received per country by the day, week, month, quarter, year, and all time. Click the “View all” link at the bottom of the Countries section to see views by country on a larger map.
If we cannot determine your visitor’s location, their visit will not be included in the Countries view. Not all visitors who visit your site will have their location enabled in their browsers. Some visitors might access your site through an incognito browser or a Virtual Private Network (VPN).

This stat will let you see how much traffic each author has generated, which can be helpful if your site has multiple users. Clicking on a name will reveal each author’s most popular posts, pages, and the number of views each has attracted.
All your site’s users can see the stats: Administrators, Editors, Authors, and Contributors. If your site is plugin-enabled, you can go to Jetpack → Settings → Traffic → Site Stats and choose which user roles can see Stats.
People used these terms, words, and phrases on search engines (like Google, Yahoo, or Bing) to find posts and pages on your website.

Please note that the default referrer policy in most browsers limits the information we can gather about the search terms directing visitors to your site.
For additional insight into search traffic to your site, we recommend connecting to Google Search Console.
This stat counts the number of times your readers have clicked on external links that appear on your site. These may be (but are not limited to):
- Links you add to your post and page content.
- Links placed in comments by your readers.
- Links attached to the names of users who comment on your site.
- Links to media files.
- Links to images in a gallery.
The Videos section tracks views on the videos uploaded to your site. You can click on the title of any video to view a chart showing daily activity for that video and a list of the places on your site where the video has been embedded.
Click on View details to see the following details for each video:
- Impressions: The number of times a video was loaded on a page.
- Hours Watched: The total number of hours that the video has been watched by all viewers.
- Views: Views are counted when a visitor clicks the play button on the video player.

This section displays information about emails sent to your subscribers for blog posts you have published. It included the number of emails opened and how many readers clicked a link in the email to visit your site.

Click the subject/title of an email to visit Email opens stats with the number of recipients, number of emails opened, and the calculated open rate. Scroll down to access details about location, devices, and email clients for that email.

While in the Email opens section, you can click on the Highlights tab for general information about the post and the Email clicks tab for activity about the clicks on the content of your email.

The link click count will update instantaneously, while the rest of the stats (total clicks, click rate, countries, etc.) are updated hourly.
This section lists the files your site’s visitors have downloaded from your site and how many times they have been retrieved. Downloads are counted for uploaded video, audio, and document file types.
Take into account that every file request is recorded in your stats. The download count also increases when the file is opened directly in the browser, or the download has not finished. Your own requests are also recorded.
Be aware that many podcast apps download files automatically for podcast audio files. A download does not necessarily mean that the podcast has been played.
File Download Stats are currently unavailable for plugin-enabled sites.